visualization inspiration
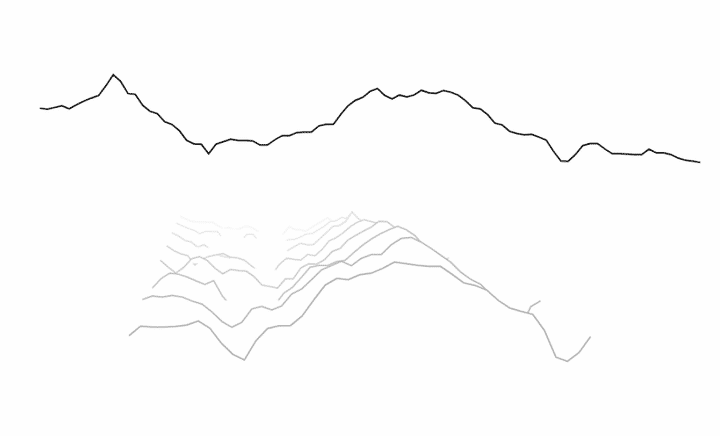
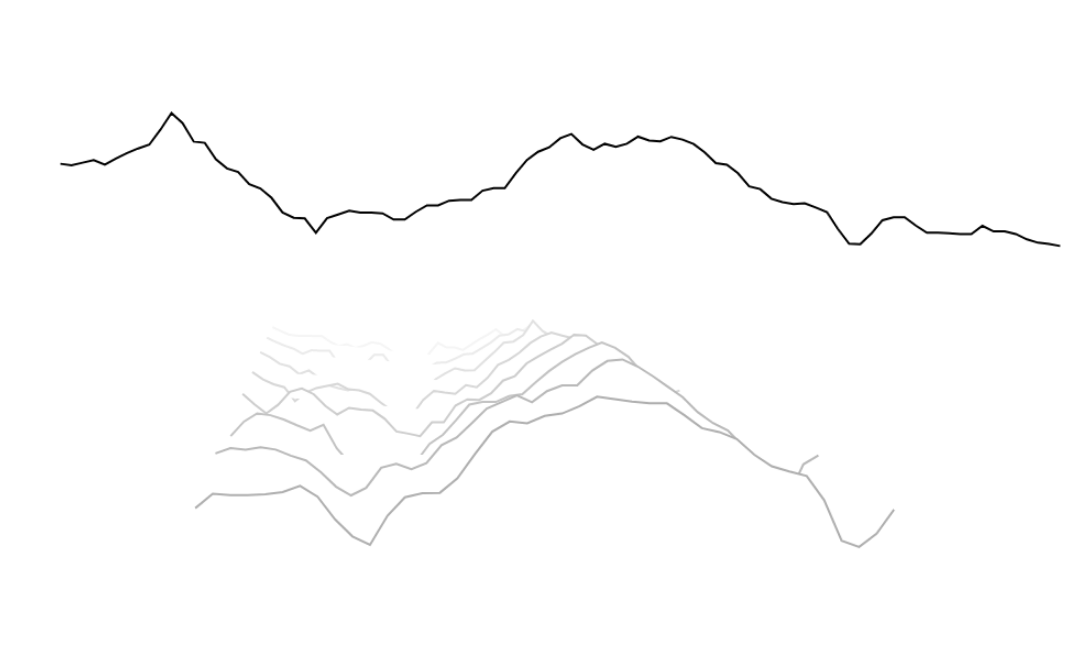
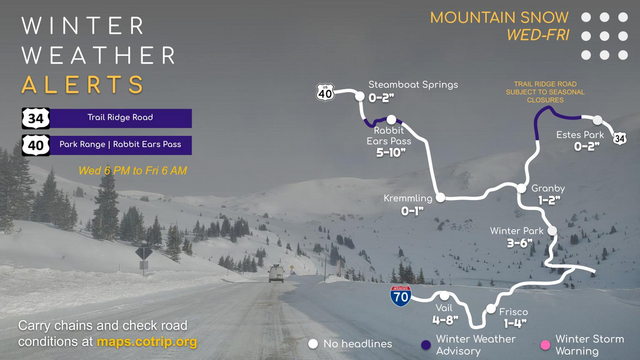
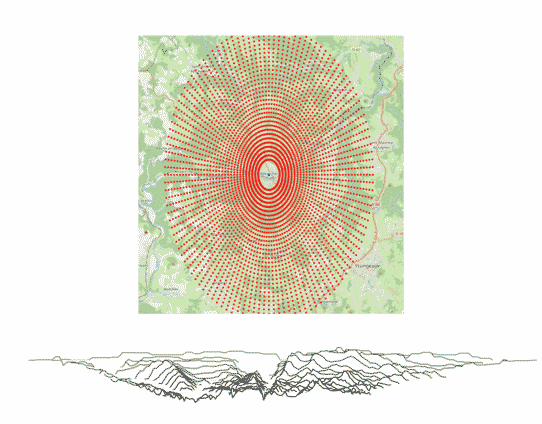 From: Adel Faure ⏚: "Design and rendering of roads …" - Mastodon.ART
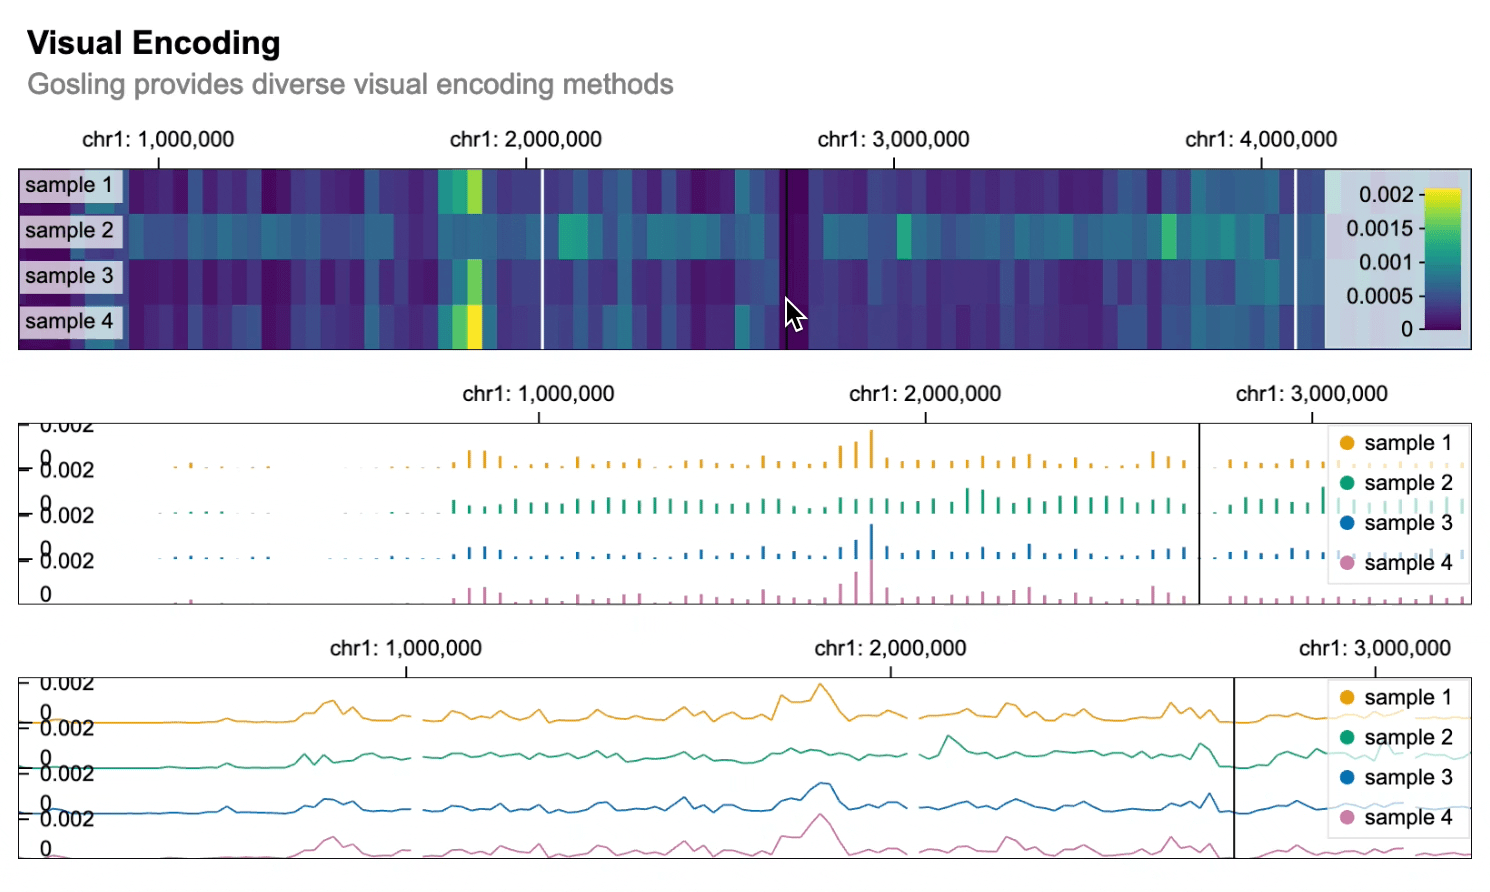
 GitHub - gosling-lang/gos: A declarative library for Python designed to create interactive multi-scale visualizations of genomics and epigenomics data.
 GitHub - hms-dbmi/viv: Library for multiscale visualization of high-resolution multiplexed bioimaging data on the web. Directly renders Zarr and OME-TIFF.


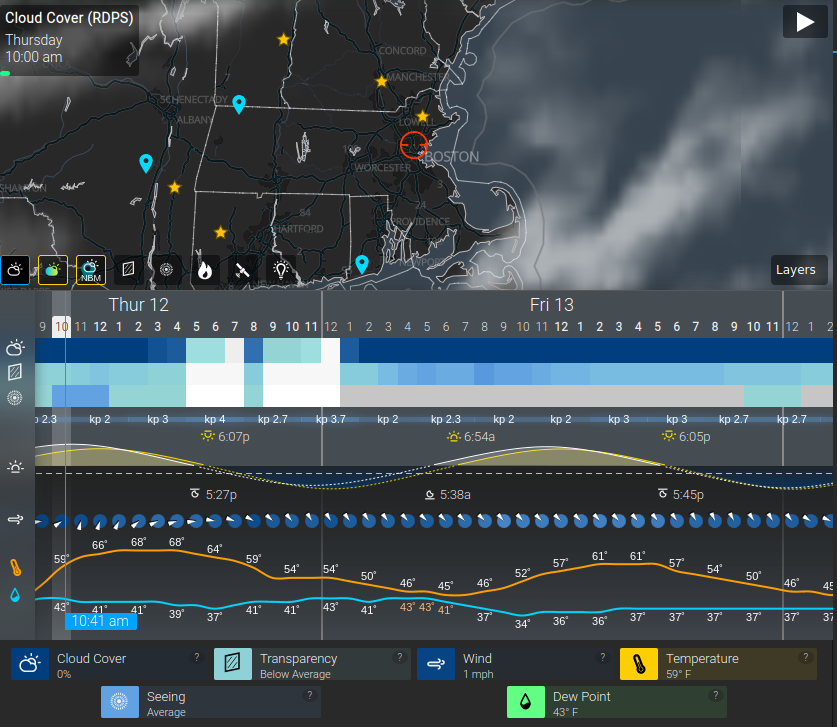
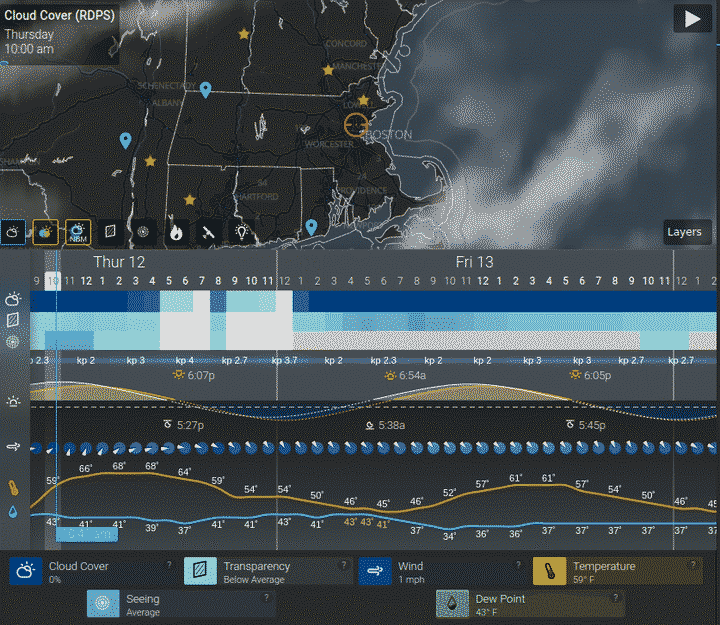 Astrospheric
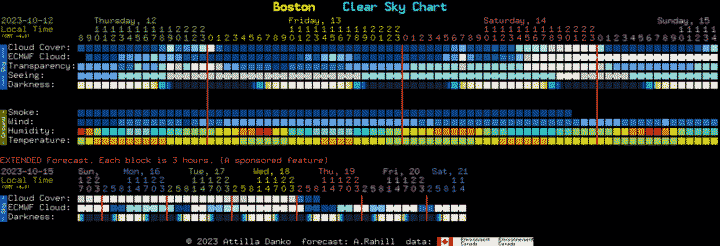 Boston Clear Sky Chart
Windy: Wind map & weather forecast

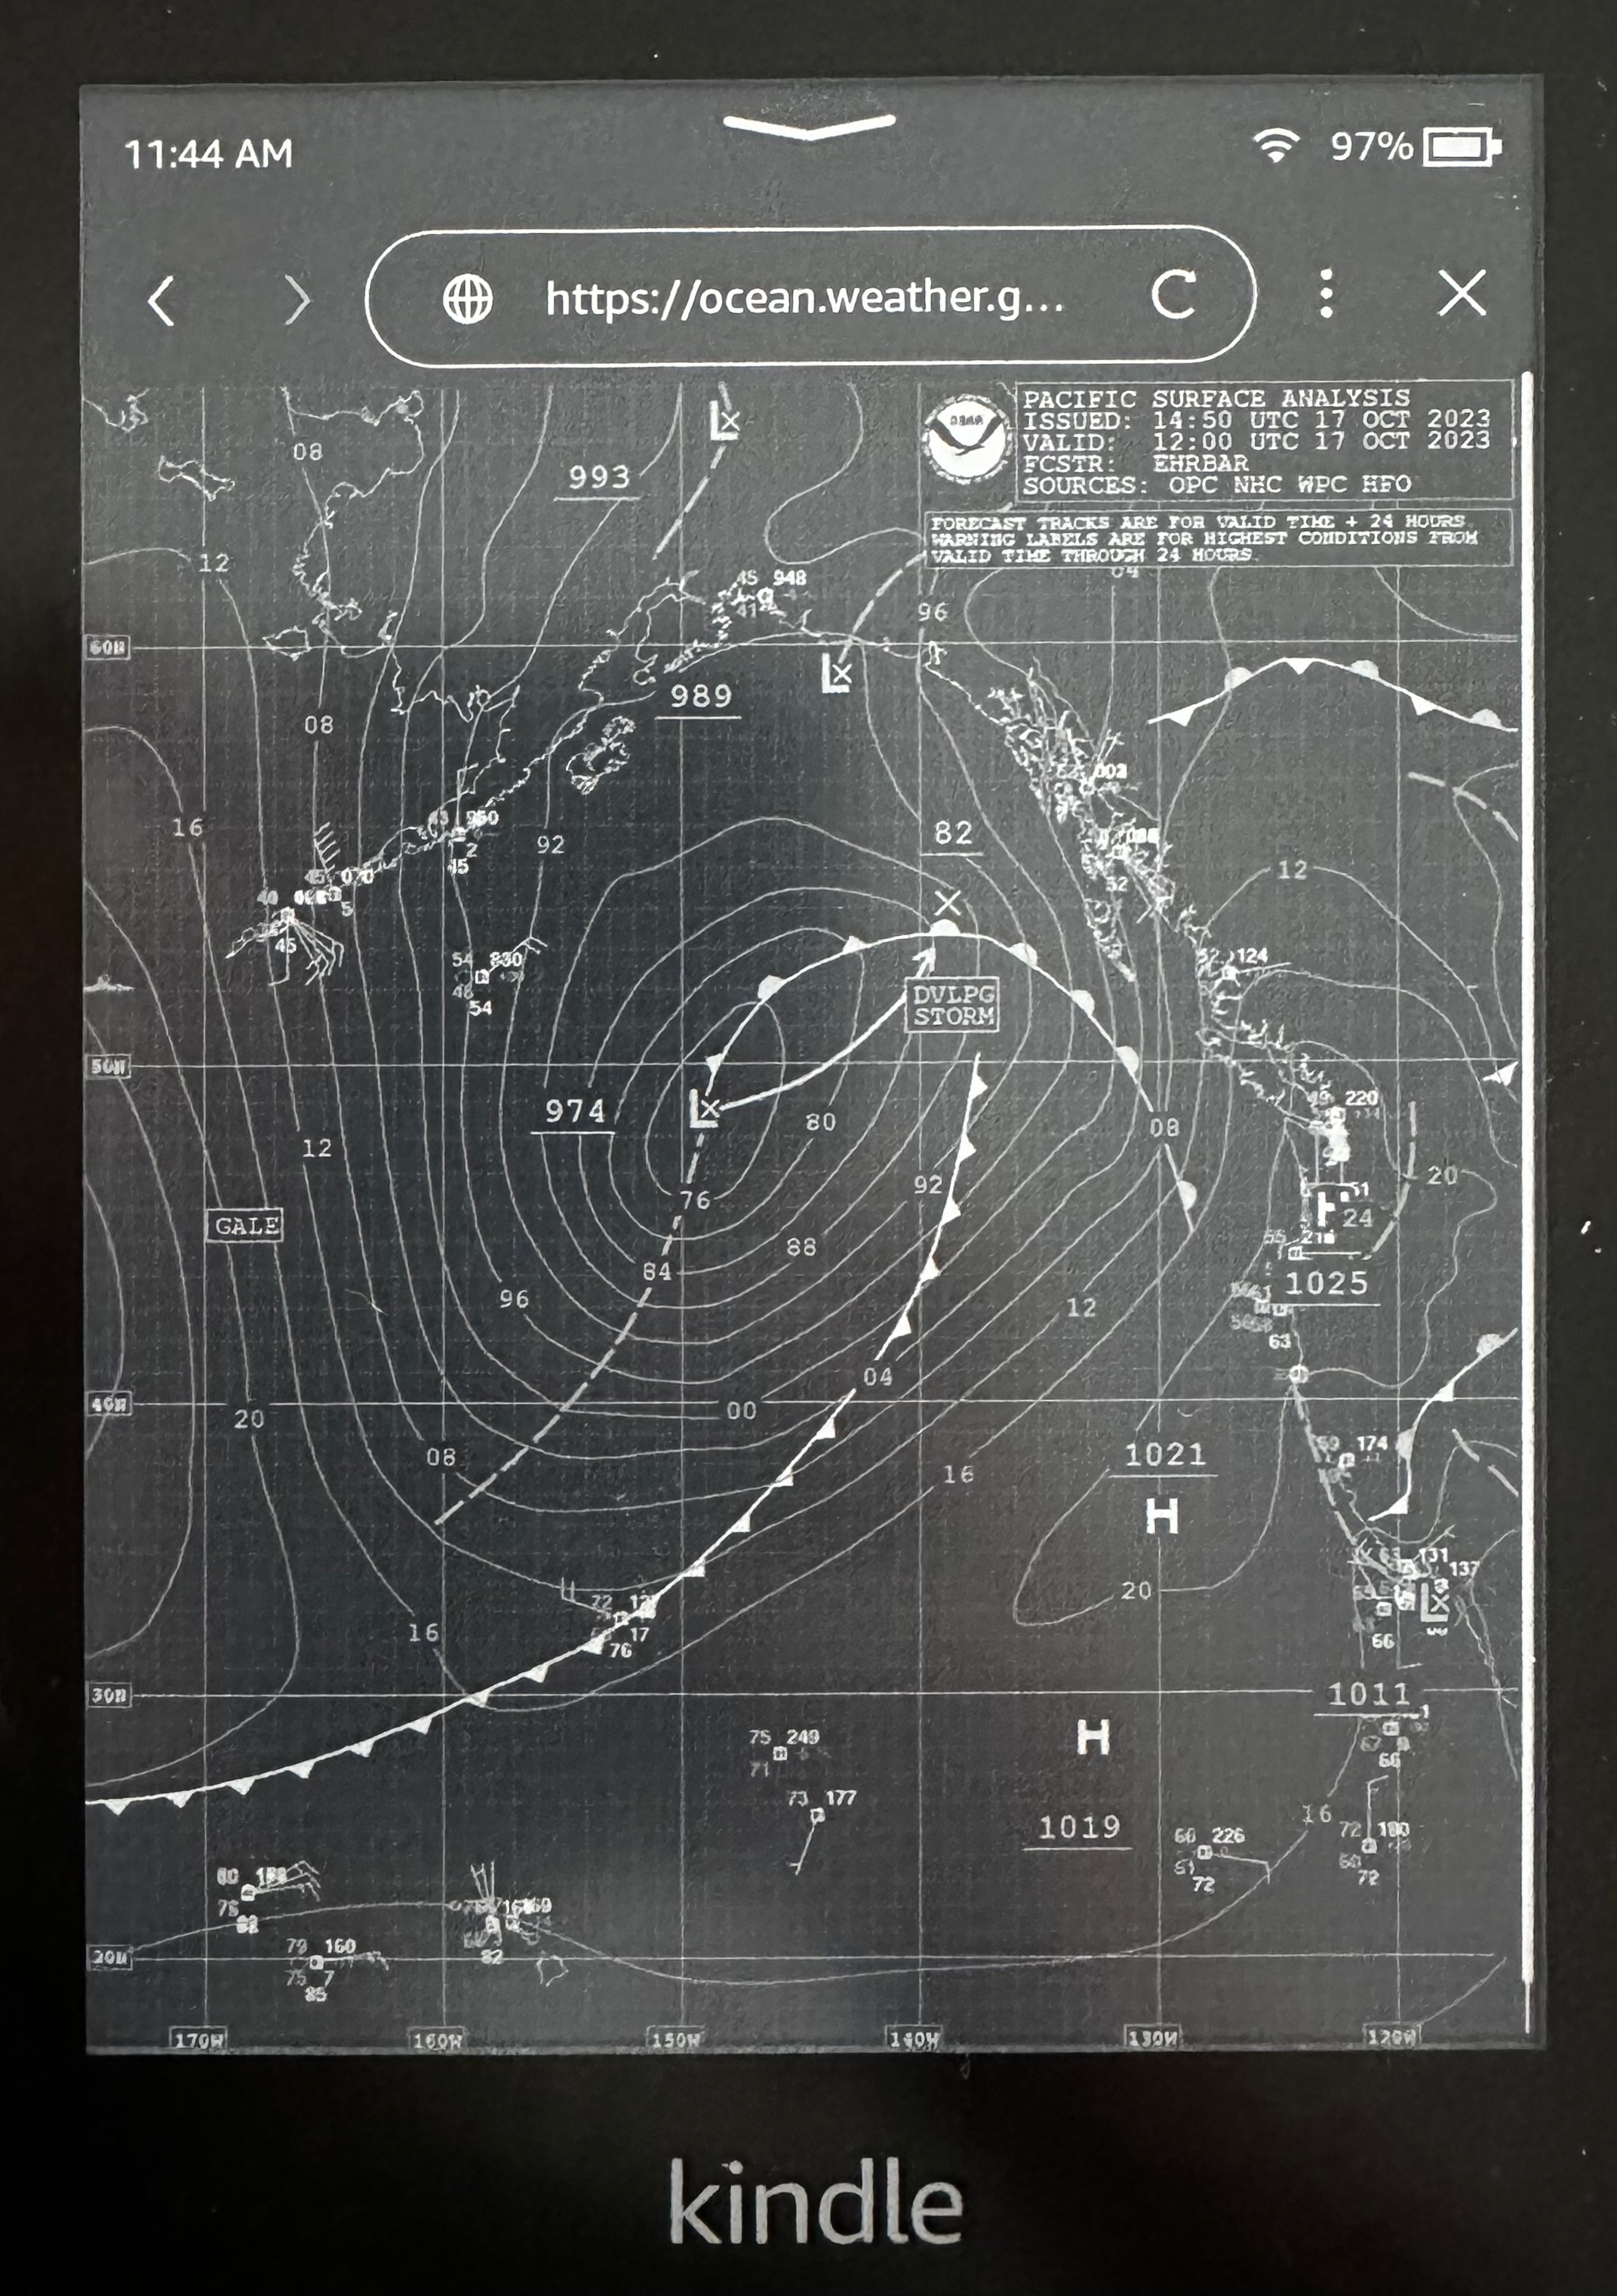
 From: Zoom Earth: "Hurricane Lidia is forecast to…" - Mapstodon
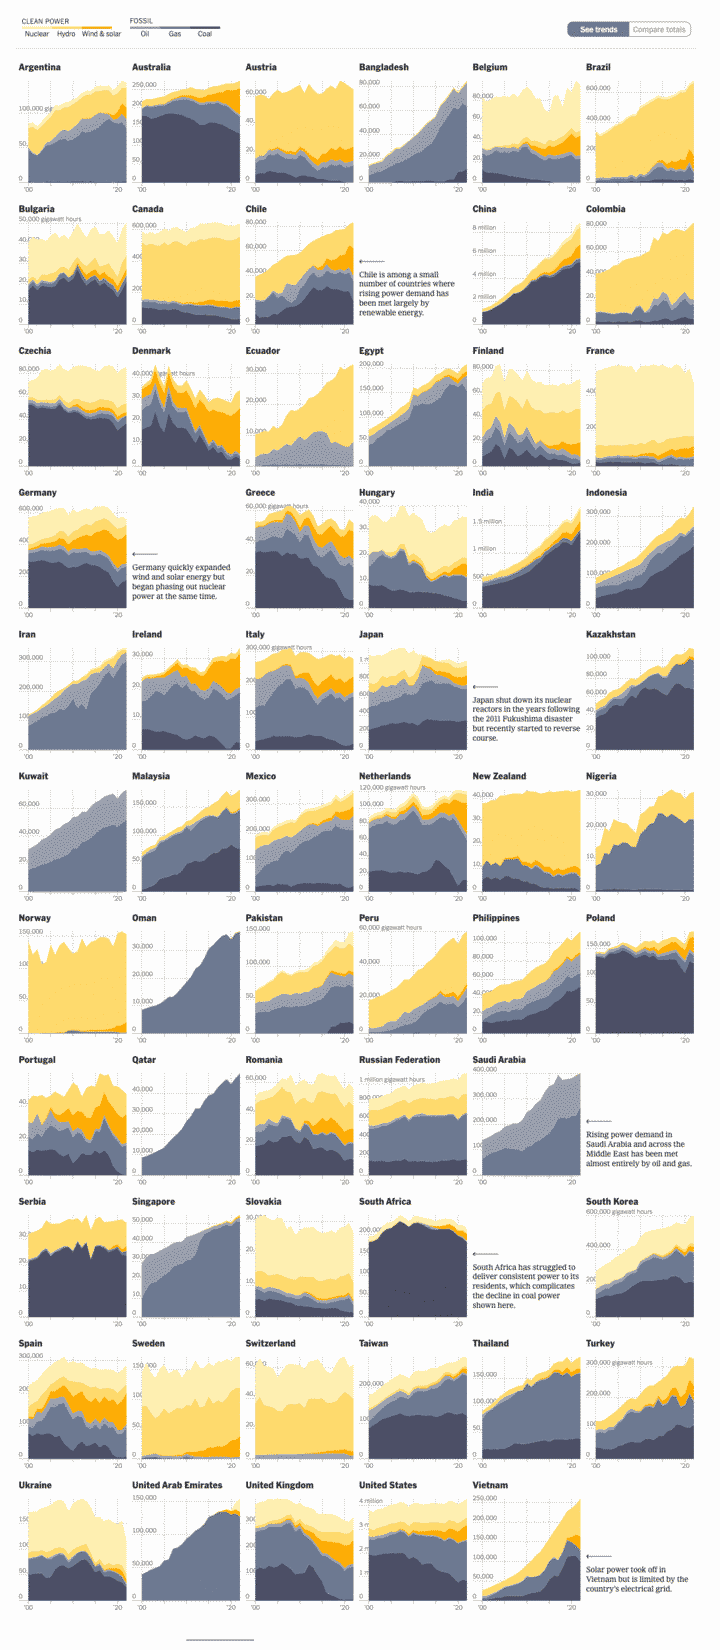
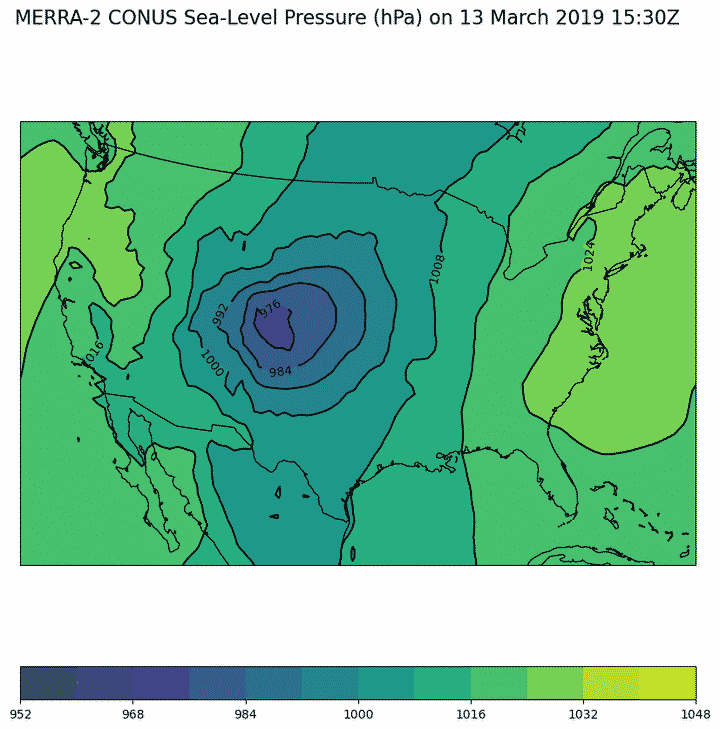
 Data source
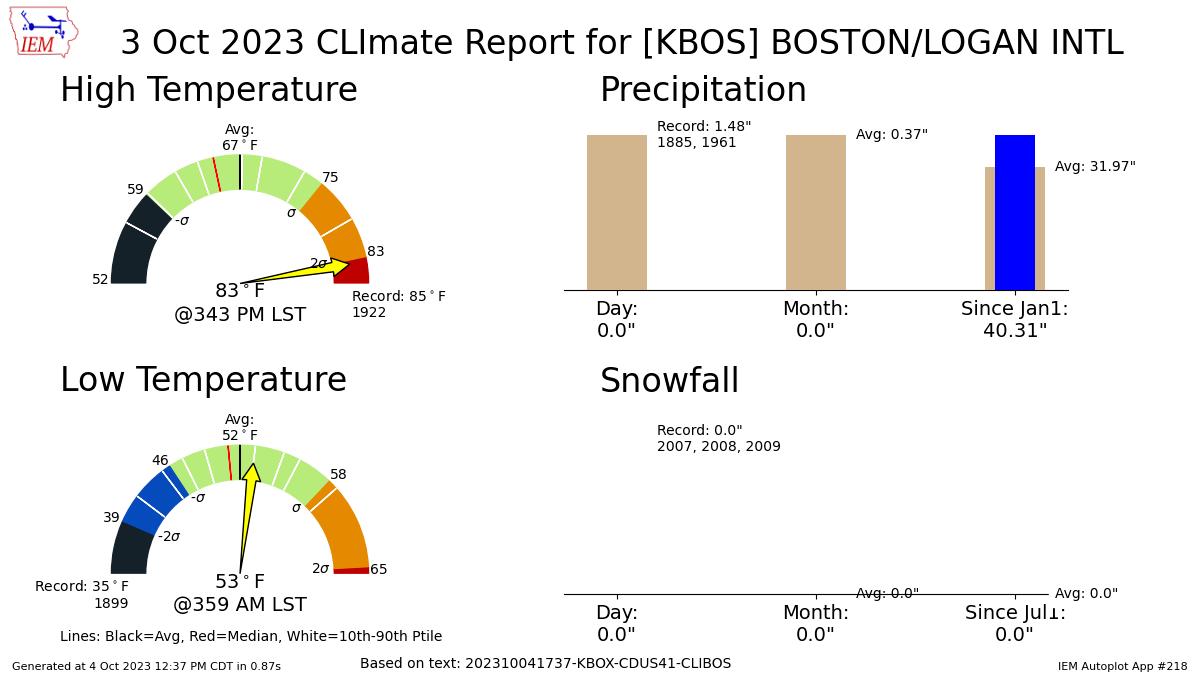
 Tufte Weather In Matplotlib — DUTC
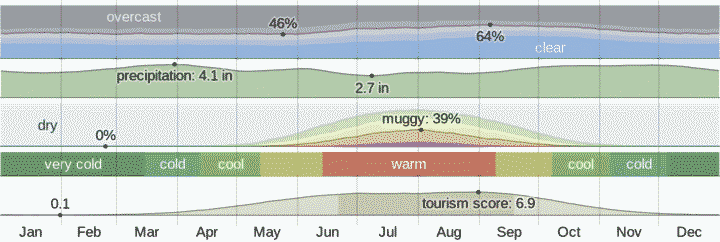 The Weather Year Round Anywhere on Earth - Weather Spark

 Notebook
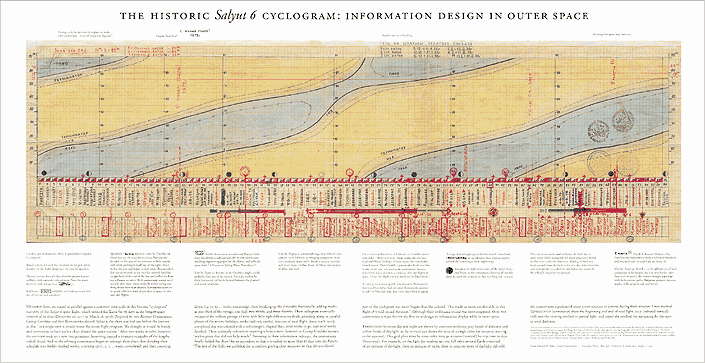
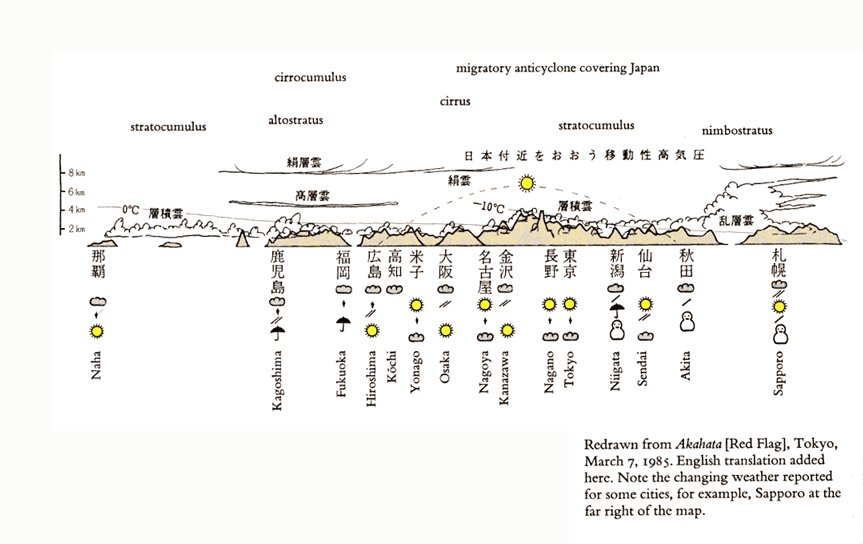
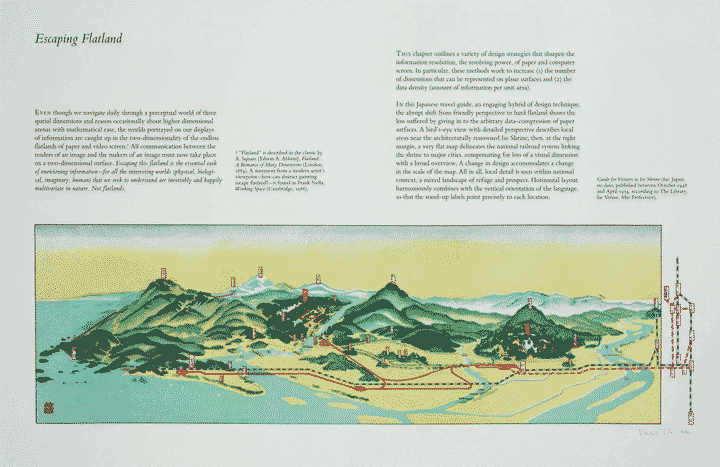
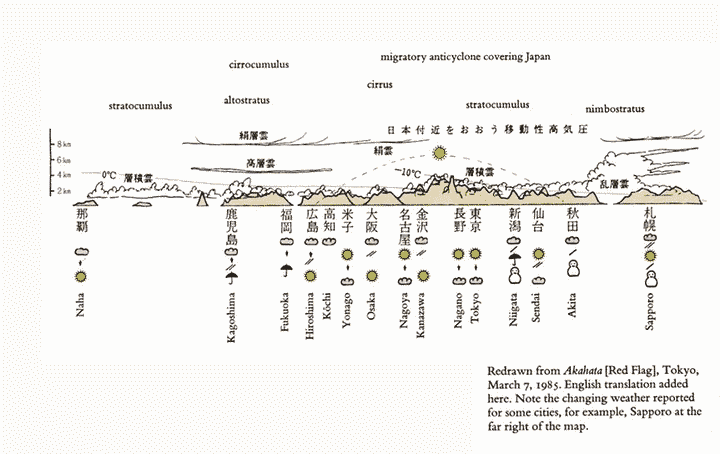
From Tufte books:

Basic Time Series Plots in Vega-Lite / Jon E. Froehlich | Observable